Sizing Up the Gap in our Supply of STEM Workers: Data & Analysis
Examining Job Postings and Unemployment Data from 2010-2016
Date: March 29, 2017
Each year on April 1, the U.S. government begins accepting applications for the H-1B program, a temporary visa program designed to bring in high-skilled workers from abroad. While the H-1B program has long been in need of updates and reforms—particularly since many of the wage requirements designed to protect American workers are almost two decades outdated—many technology firms say it has been instrumental in helping them recruit the talent they need to grow and remain competitive in our increasingly innovation-driven economy. This is because of what experts call our country’s skills gap: The U.S. labor force simply doesn’t have enough workers with the highly specialized training in Science, Technology, Engineering, and Math (or STEM) that many employers need to grow and add jobs for American workers overall.1
In recent years, however, some policymakers have raised questions about whether the shortage of STEM workers is truly as severe as the public has been lead to believe. Individuals making this critique frequently point to data from the U.S. Census showing that three out of every four Americans with undergraduate degrees in a STEM field go on to work in other professional fields after graduation.2 This leads one to wonder: Are these individuals working in non-STEM occupations because there are not enough STEM jobs available to employ them? Or, could it be that these U.S.-born workers—many of whom are employed in related areas like healthcare and business that are not counted as STEM—have instead opted to pursue jobs that are either more lucrative or appropriate for their underlying interests?
In this brief, we use data from the Burning Glass Technologies, a leading market analytics firm, to look directly at the number of STEM job postings in recent years—one of the best real-time indicators of the jobs available to interested workers with relevant STEM training. Labor Insight, a tool produced by Burning Glass, scours 40,000 job boards daily to study the number of type of unique positions being advertised online by U.S. employers. Using that tool, we compare the number of online STEM job postings in recent years to the number of unemployed STEM workers available to fill them. This technique has been used in the past to determine the magnitude of gaps in our labor market—both by NAE and other groups.3
Our work shows that the United States has a persistent and dramatic shortage of STEM workers—a problem that worsened considerably during the first half of the decade. Between 2010 and 2015, the ratio of STEM jobs posted online to unemployed STEM workers grew dramatically. In 2010, just 5.4 STEM jobs were posted online for every one unemployed STEM worker. By 2015, such job postings outnumbered unemployed STEM workers by a factor of almost 17 to 1. While the picture improved moderately in 2016, STEM employers still faced a dire picture: 13 STEM jobs were posted online for each unemployed worker that year—or roughly 3 million more jobs than the number of available, trained professionals who could potentially fill them.
NUMBER OF STEM JOBS ADVERTISED ONLINE FOR EACH UNEMPLOYED STEM WORKER, 2010-2016
| 2010 | 2011 | 2012 | 2013 | 2014 | 2015 | 2016 | |
|---|---|---|---|---|---|---|---|
| Number of STEM Jobs Posted Online for Each Unemployed STEM Worker | 5.4 | 7.1 | 7.1 | 8.4 | 9.8 | 16.8 | 13.0 |
Source: Current Population Survey and Burning Glass Labor Insights.
Source: Current Population Survey and Burning Glass Labor Insights.
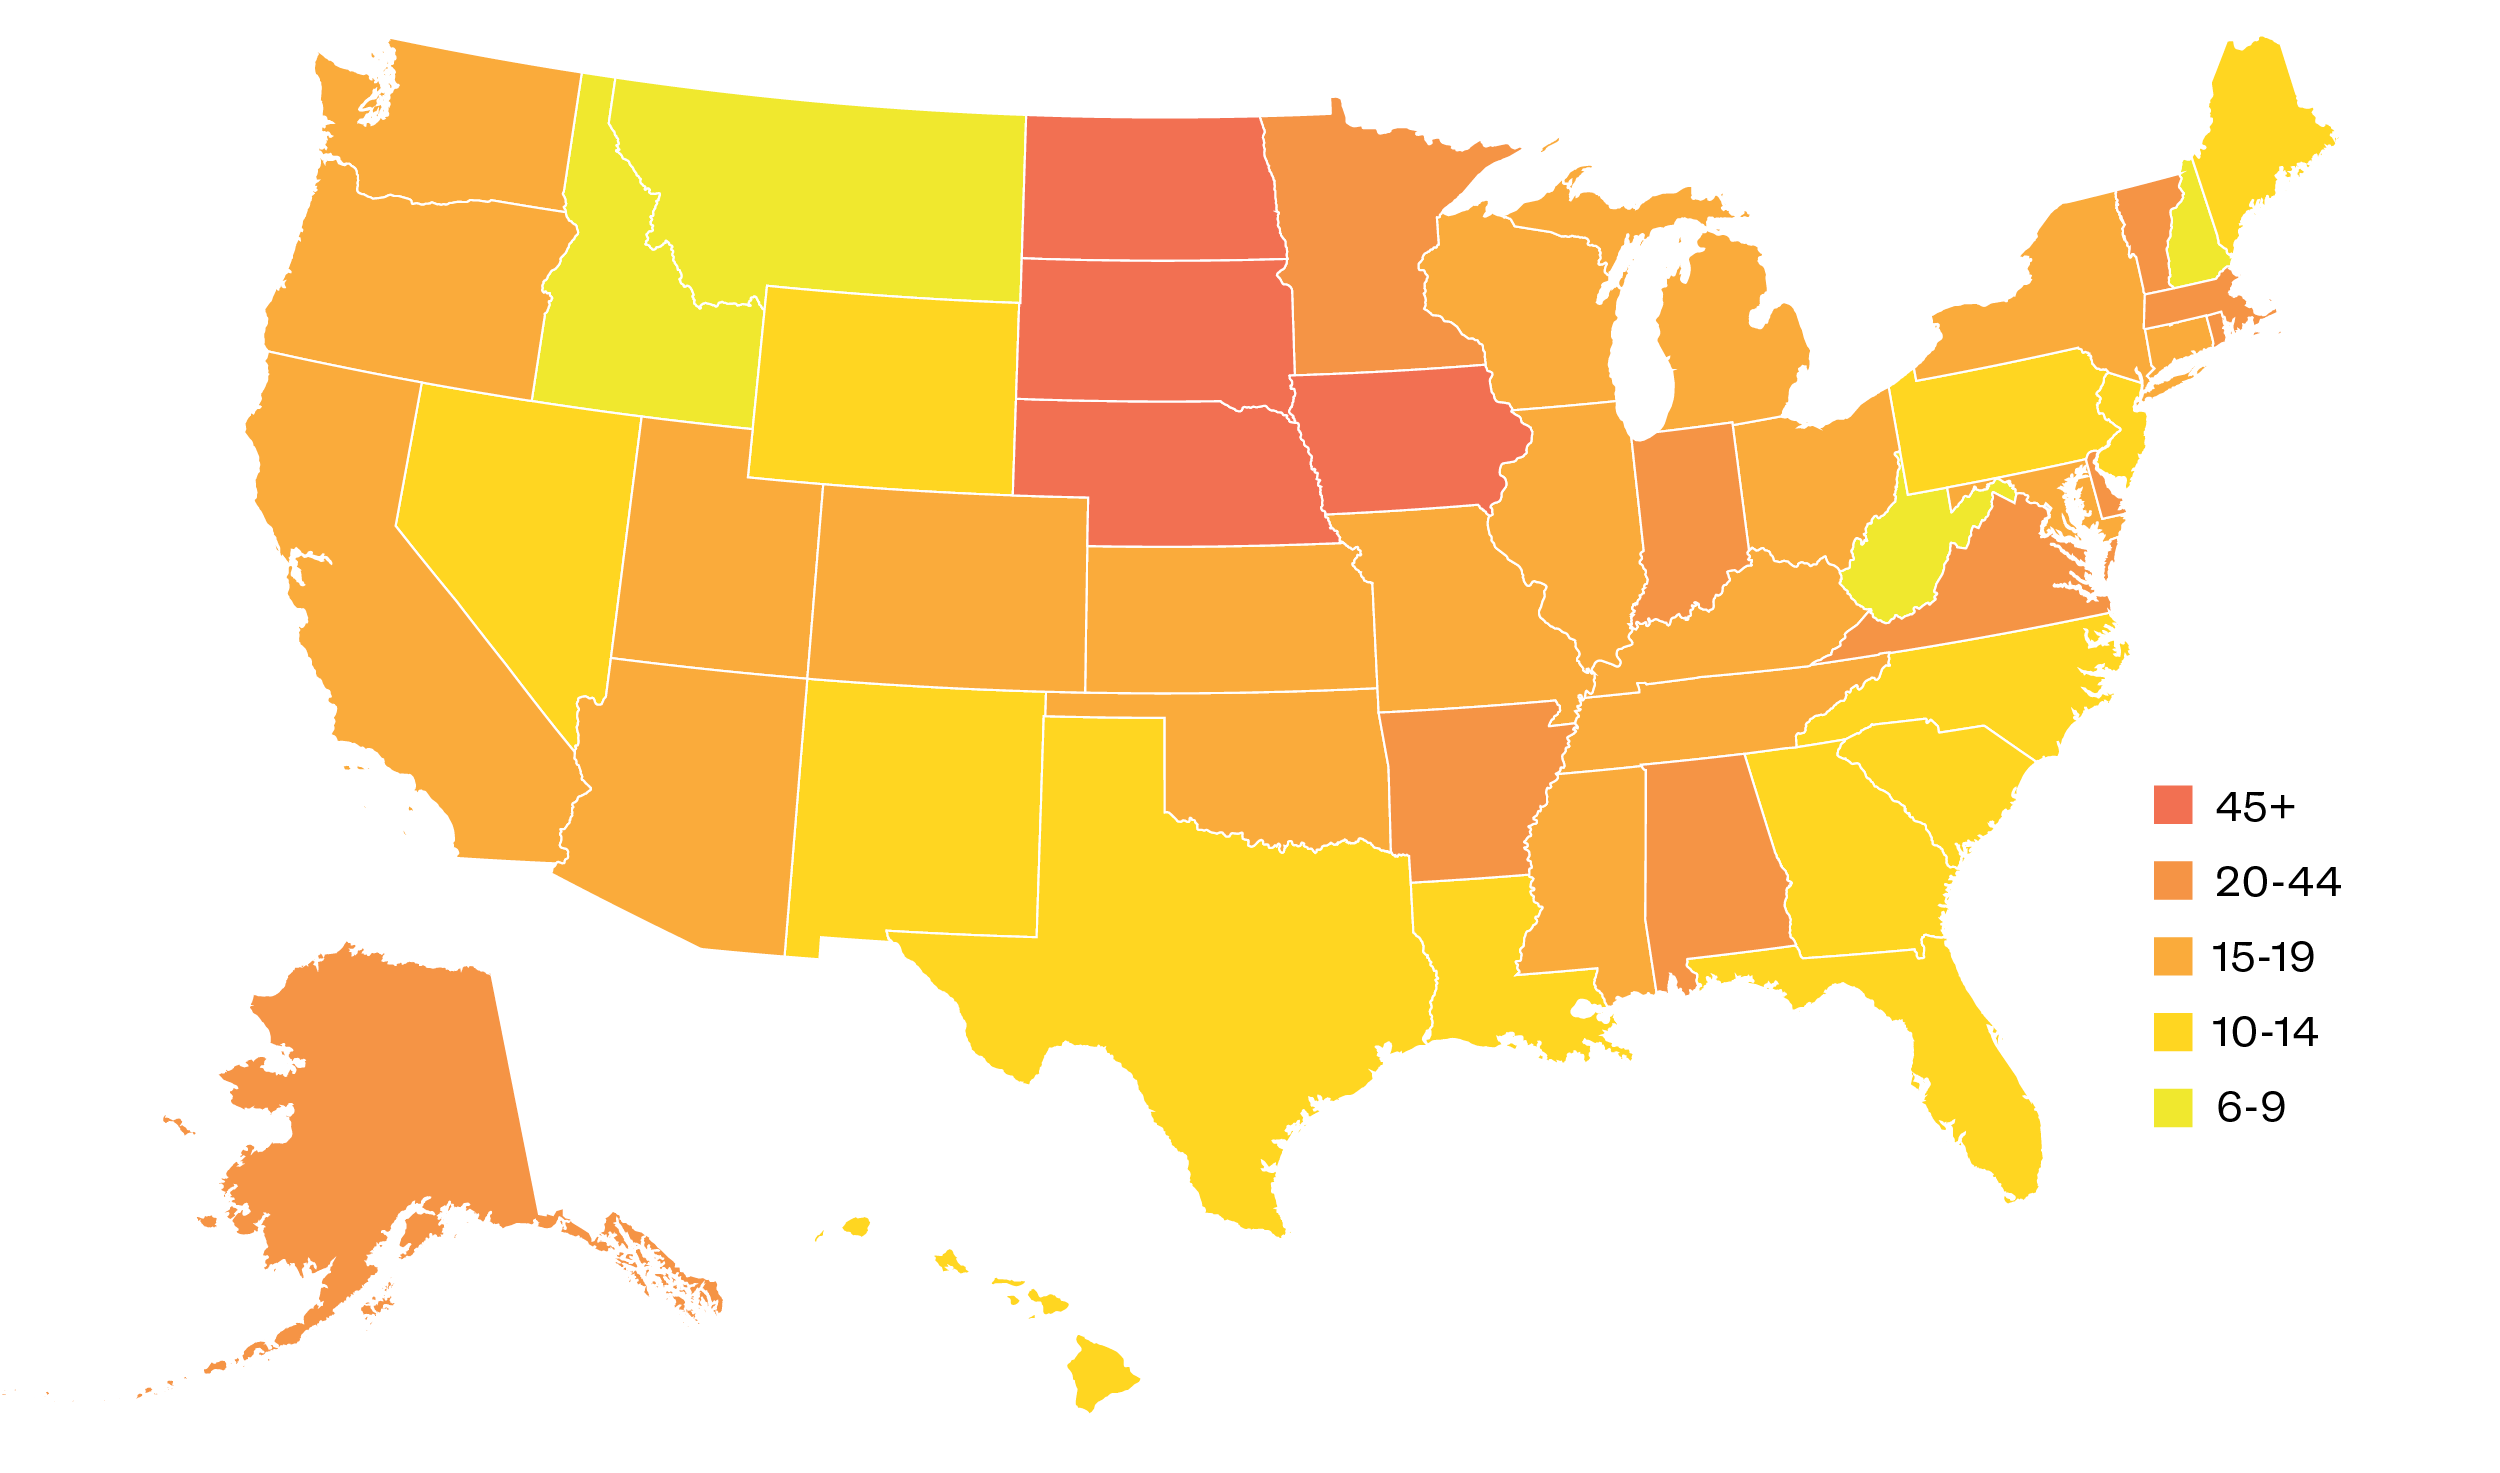
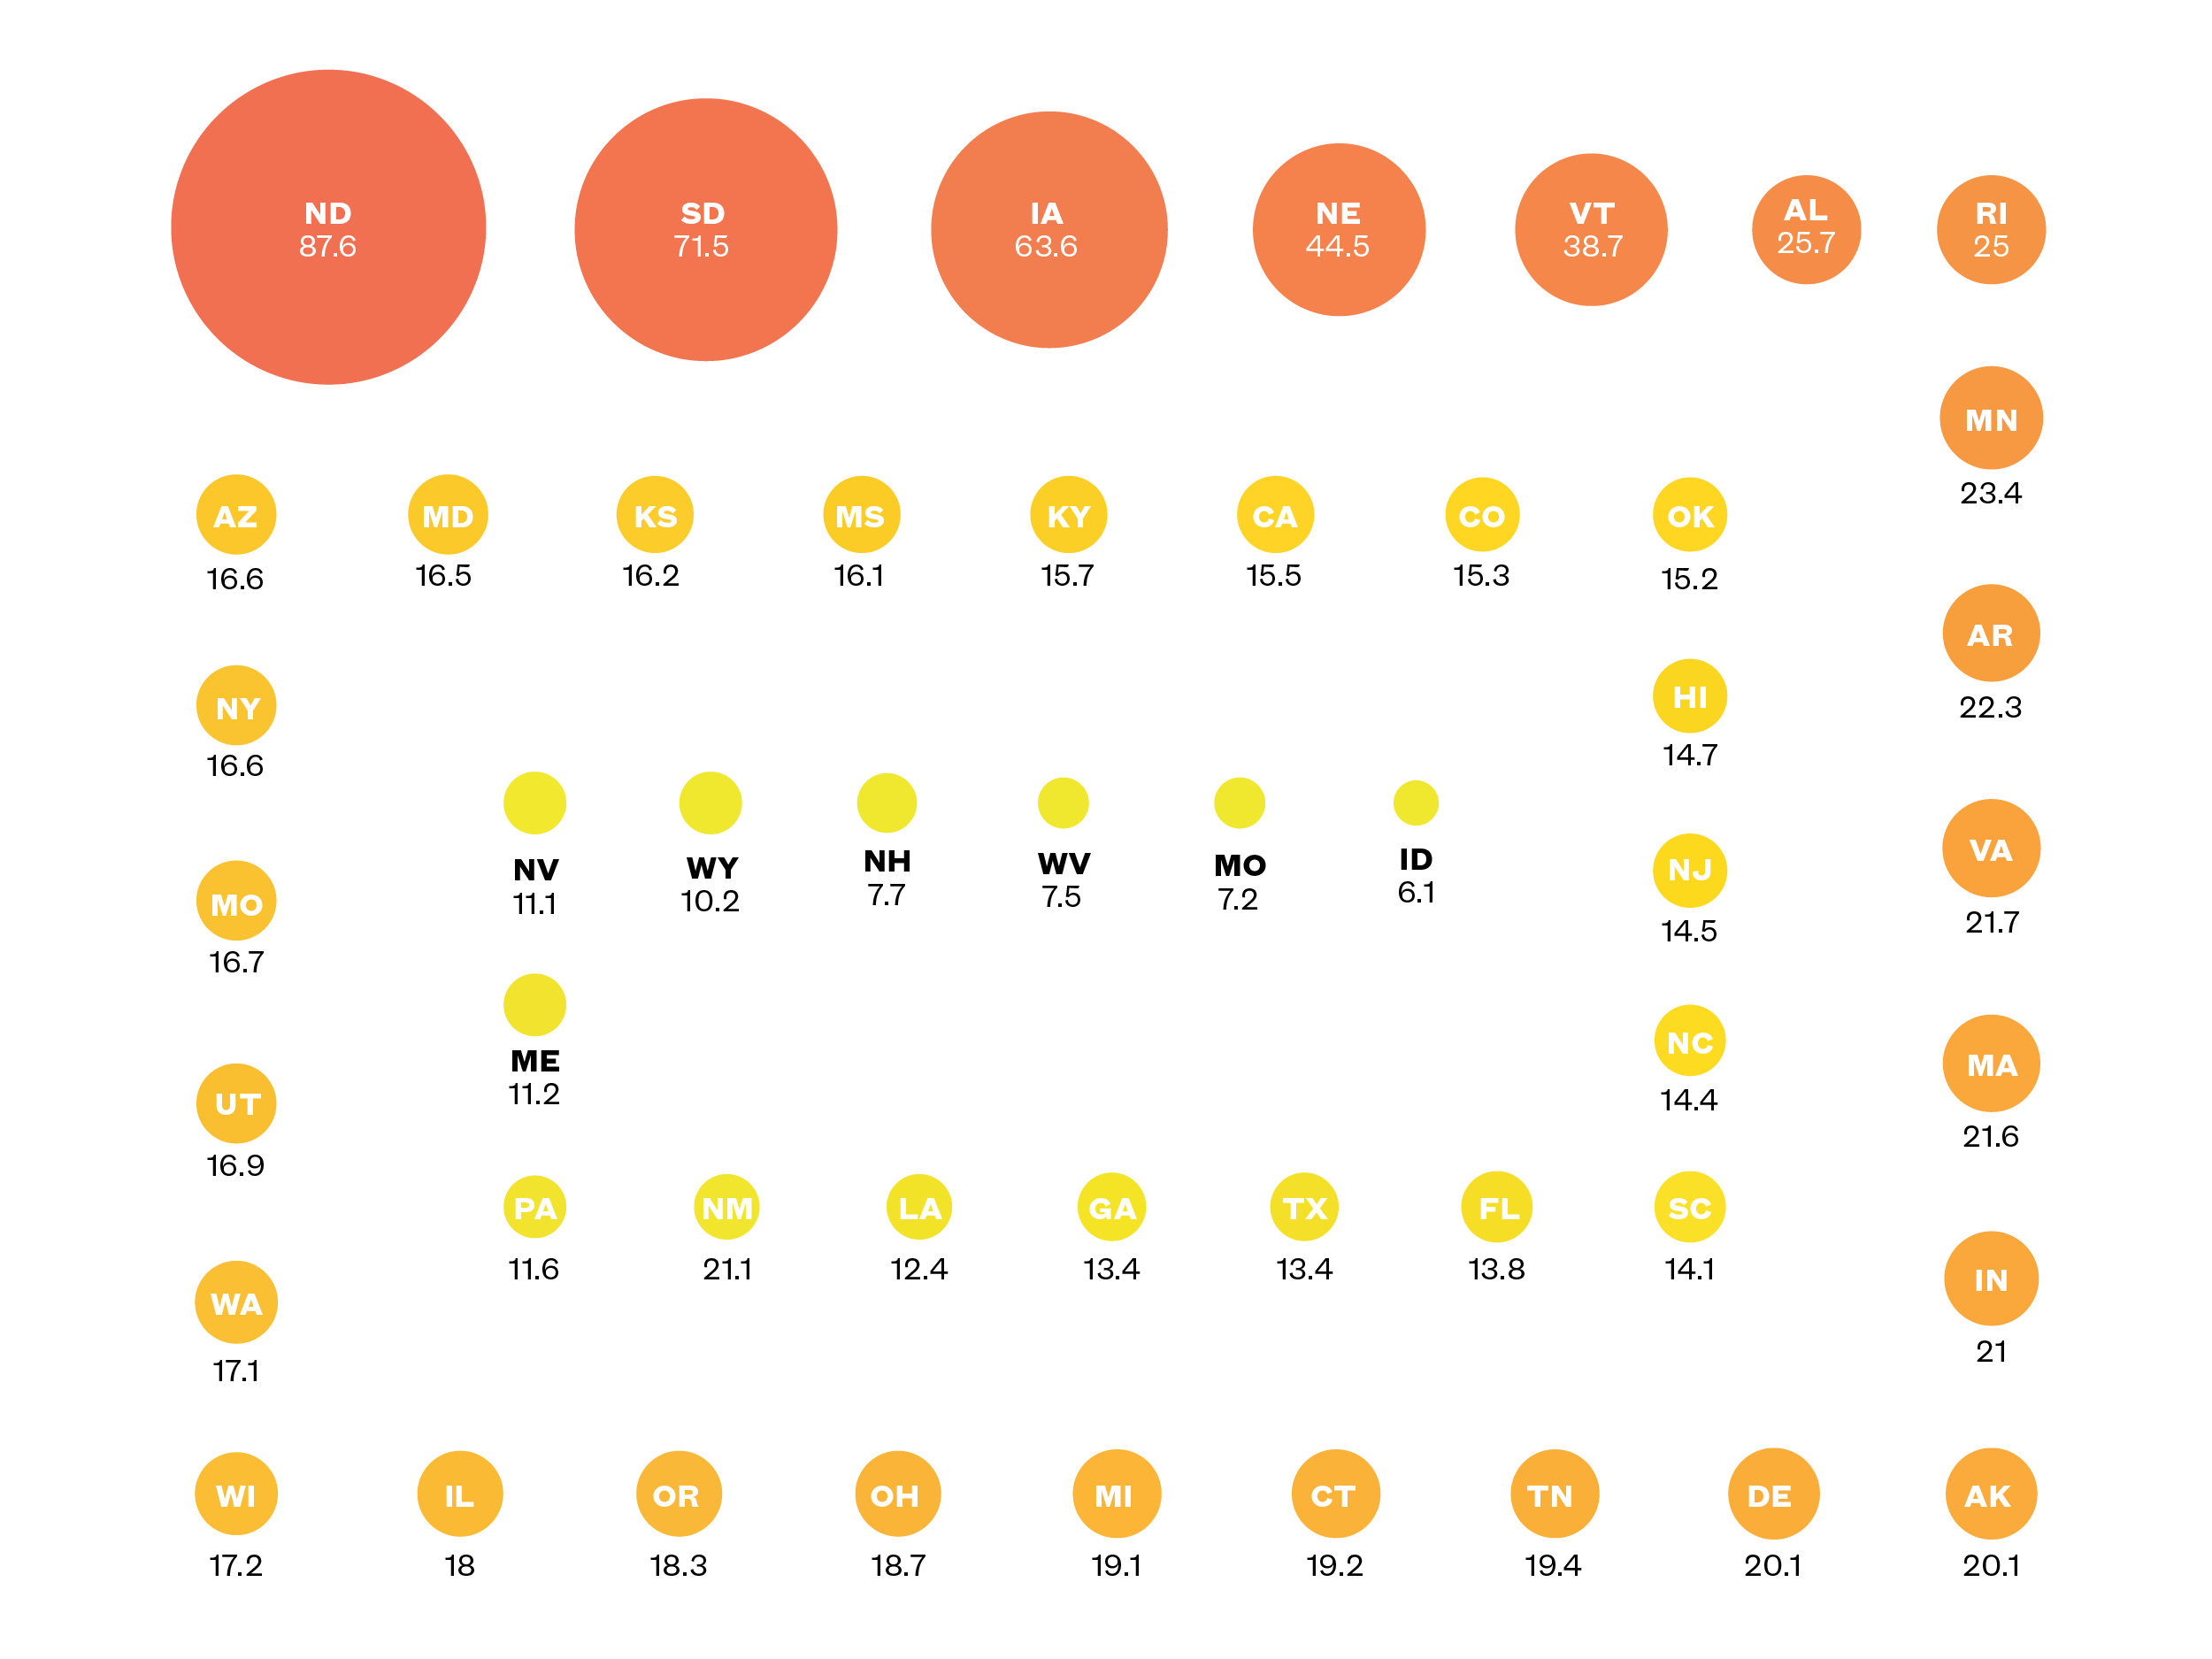
Drilling down to specific states, we can see that some communities face far greater shortages of STEM talent than others. In 2015, employers in four relatively rural states faced the largest gap between the number of STEM jobs advertised online and the size of the unemployed STEM-trained population who could fill them. In each of these states—North Dakota, South Dakota, Iowa, and Nebraska—there were between 45 and 88 STEM jobs posted online for every one unemployed eligible worker. In a total of 14 states, the number of advertised STEM jobs outnumbered unemployed STEM workers by more than 20 to 1. This group included places as varied as Indiana, Virginia, Arkansas, and Alabama.
NUMBER OF STEM JOBS ADVERTISED ONLINE FOR EACH UNEMPLOYED STEM WORKER, BY STATE, 2015


Our work also reveals one of the reasons why employers have struggled to find enough STEM workers in recent years. Even in 2010, a period of relatively high unemployment, the share of unemployed STEM workers was incredibly low. In 2010, the unemployment rate of U.S. STEM workers was just 5.9 percent, compared to 9.6 percent for the entire population of American workers. By 2016, the STEM unemployment rate had fallen to just 2.7 percent. To put that figure in context, the U.S. government generally defines “full employment” as a period when unemployment falls at 4 percent or below. PERCENT OF STEM WORKERS UNEMPLOYED, 2010-2016 Source: Author’s analysis of the Current Population Survey, Annual Social and Economic Supplement, 2010-2016. Source: Author’s analysis of the Current Population Survey, Annual Social and Economic Supplement, 2010-2016.
2010
2011
2012
2013
2014
2015
2016
Full Employment
4
4
4
4
4
4
4
Unemployment Rate
5.9
4.1
3.9
3.7
3.2
2.6
2.7
Methodology
Our analysis of the number of jobs posted for healthcare workers or individual occupations makes use of the Labor Insight tool developed by Burning Glass Technologies, a leading labor market analytics firm. Burning Glass, which is used by policy researchers and academics, scours almost 40,000 online sources daily and compiles results on the number and types of jobs and skills being sought by U.S. employers. This search includes online job boards, individual employer sites, newspapers, and public agencies, among other sources. An artificial intelligence tool eliminates duplicate listings.
To calculate the number of unemployed workers we rely on two data sources—the Current Population Survey and the American Community Survey, both from the U.S. Census. The CPS is used for our national-level results because it allows us to carry out analysis through 2016. At the state level, however, we chose to use the ACS to estimate the number of unemployed STEM workers. That is because the smaller sample size of the CPS makes this result less reliable when viewed at the state level, particularly for smaller states.
We use the STEM occupation list released by U.S. Census Bureau to determine the number and share of foreign-born STEM workers who are unemployed each year. Per U.S. Census classification, healthcare workers such as physicians and dentists are not counted as working in STEM occupations.4 All unemployed workers who list their previous job as a STEM occupation are counted as unemployed STEM workers. The unemployment rate for that group is the share of such workers who are unemployed at the time of the survey.
Sources
- “The 21st Century Workforce: Skills Gap & The STEM Dilemma,” MathMovesU from Raytheon, 2013, Available online; “Solving the Skills Gap,” Text, Change the Equation, (December 3, 2014), Available online.
- “Where Do College Graduates Work? A Special Focus on Science, Technology, Engineering, and Math,” U.S. Census Bureau, July 10, 2014, Available online.
- Jonathan Rothwell, “Still Searching: Job Vacancies and STEM Skills | Brookings Institution” (Brookings, November 30, 2001), Available online; “STEM Help Wanted” (Change the Equation, March 2012), Available online; “Who Will Care for Our Seniors?” (New American Economy, September 2016), Available online.
- U.S. Census Bureau, “STEM, STEM-related, and NonSTEM Occupation Code List 2010,” 2010. Available online.